
Predicting a race winner in motorsport feels part art, part number-crunching obsession. On the surface it’s obvious: fastest car plus best driver usually wins. But dig a little deeper and you find a collection of data — telemetry, weather, tyre wear, pit-stop strategy, and even pit-lane data — all nudging probabilities one way or another.
What models actually use
Analysts feed machine-learning models with historical race data: lap times, sector splits, qualifying performance, pit-stop durations, safety-car frequency, track characteristics, and driver histories. Models range from logistic regression for simple odds to more complex ensembles like random forests and gradient-boosted trees that capture nonlinear relationships. These algorithms learn which variables consistently predict strong finishes and which are red herrings.
Telemetry is gold. Continuous streams of data about engine performance, speed traces and brake temperatures let teams and forecasters quantify how a car behaves under different loads. Combining that data with weather forecasts and tyre-degradation models allows teams to estimate how lap times will drift during a stint. It isn’t perfect, but it’s useful.
Human factors and strategy
Numbers alone don’t tell the whole story. Driver skill under pressure — the late-braking heroics, the calm through Turn 1 chaos — is measurable, but only indirectly. Racecraft metrics, like overtaking success rate or defensive laps, are added features in models. Then there’s strategy: a well-timed undercut can leapfrog a faster car stuck in traffic. Teams simulate hundreds of strategy permutations before a race; those simulations feed predictive models, tightening the probabilities.
And of course, random events happen. Safety cars, red flags, mechanical failures: they introduce noise that models treat as probabilistic risk rather than deterministic outcomes. That’s why probabilistic forecasts (percent chances) are more honest than absolute predictions.
Betting markets and information flow
Bookmakers and betting markets act as real-time aggregators of information. Odds adjust quickly as qualifying results, practice pace, or last-minute grid penalties surface. Markets also reflect crowd sentiment; heavy wagers can move lines and, in turn, shift implied probabilities. For serious forecasters, market odds are a valuable input because they summarize both hard data and public reaction in one number.
Why do some models outperform others? It often comes down to feature engineering and data freshness. A model trained on last year’s tracks may miss this season’s rule tweaks or an upgraded power unit. Freshness matters.
Limits and responsible use
Remember: prediction is not prophecy. Good models quantify uncertainty. They’ll say a driver has a 30–40% chance, not “will win.” Use forecasts as decision tools, not guarantees. For bettors, that nuance is crucial: value bets appear when the model’s probability disagrees with market odds.
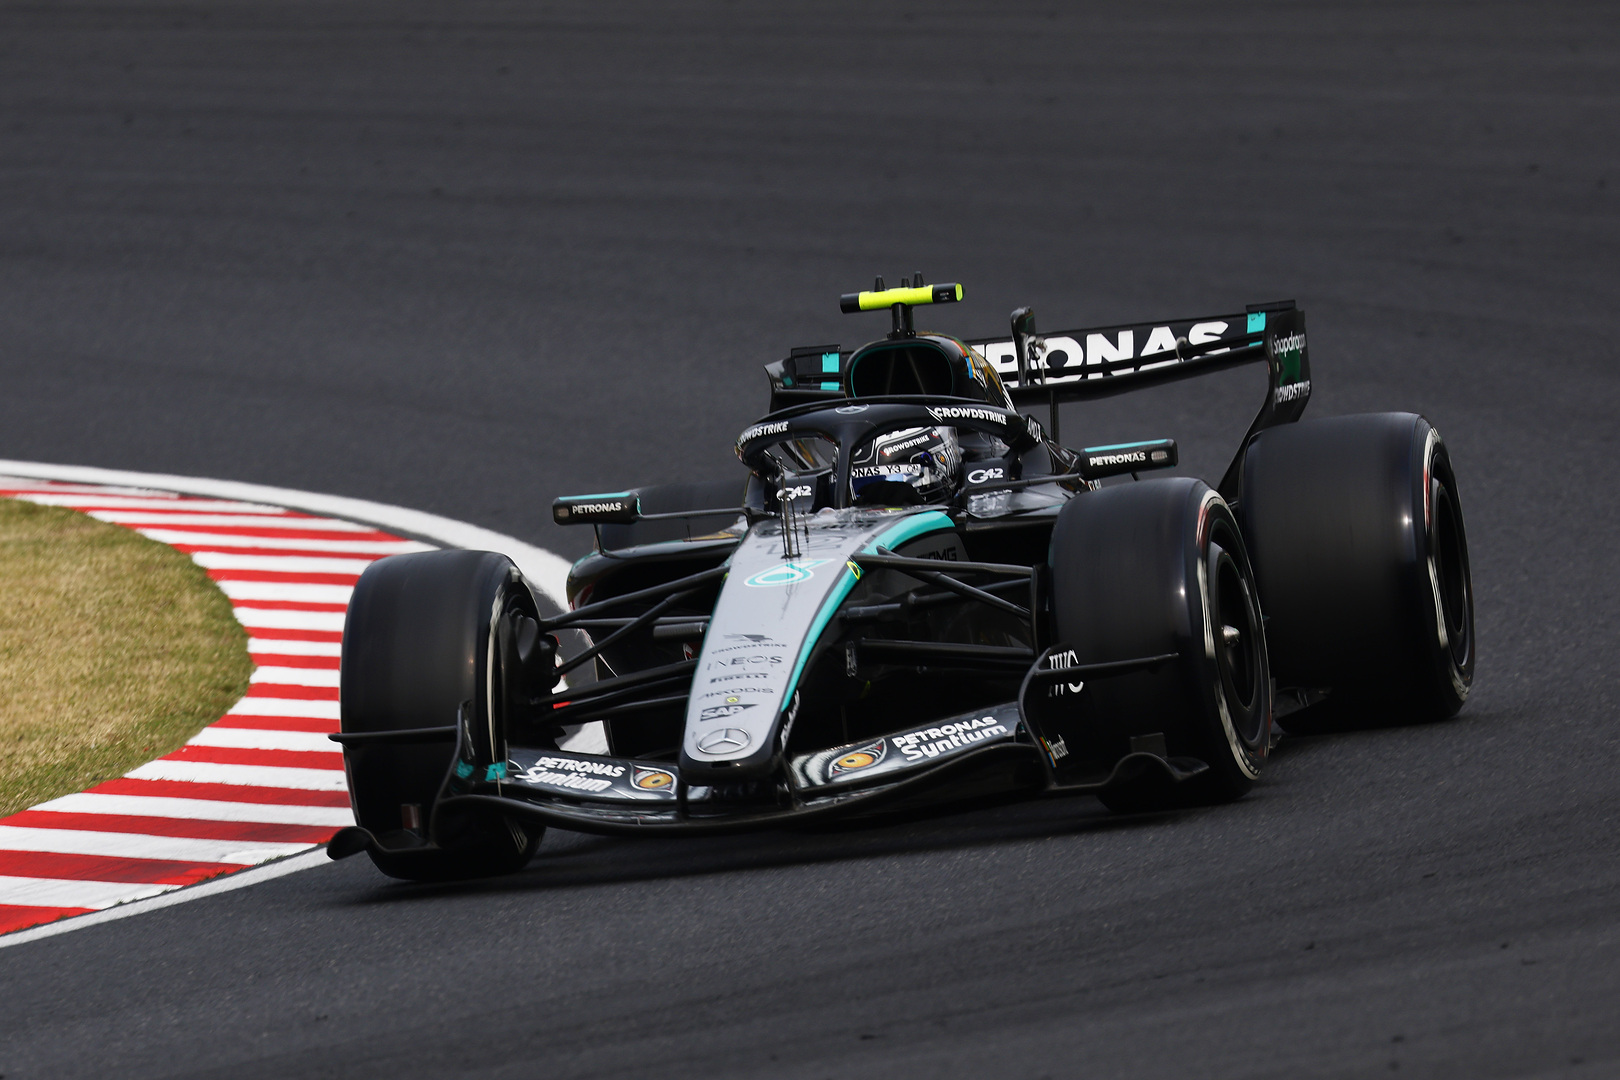
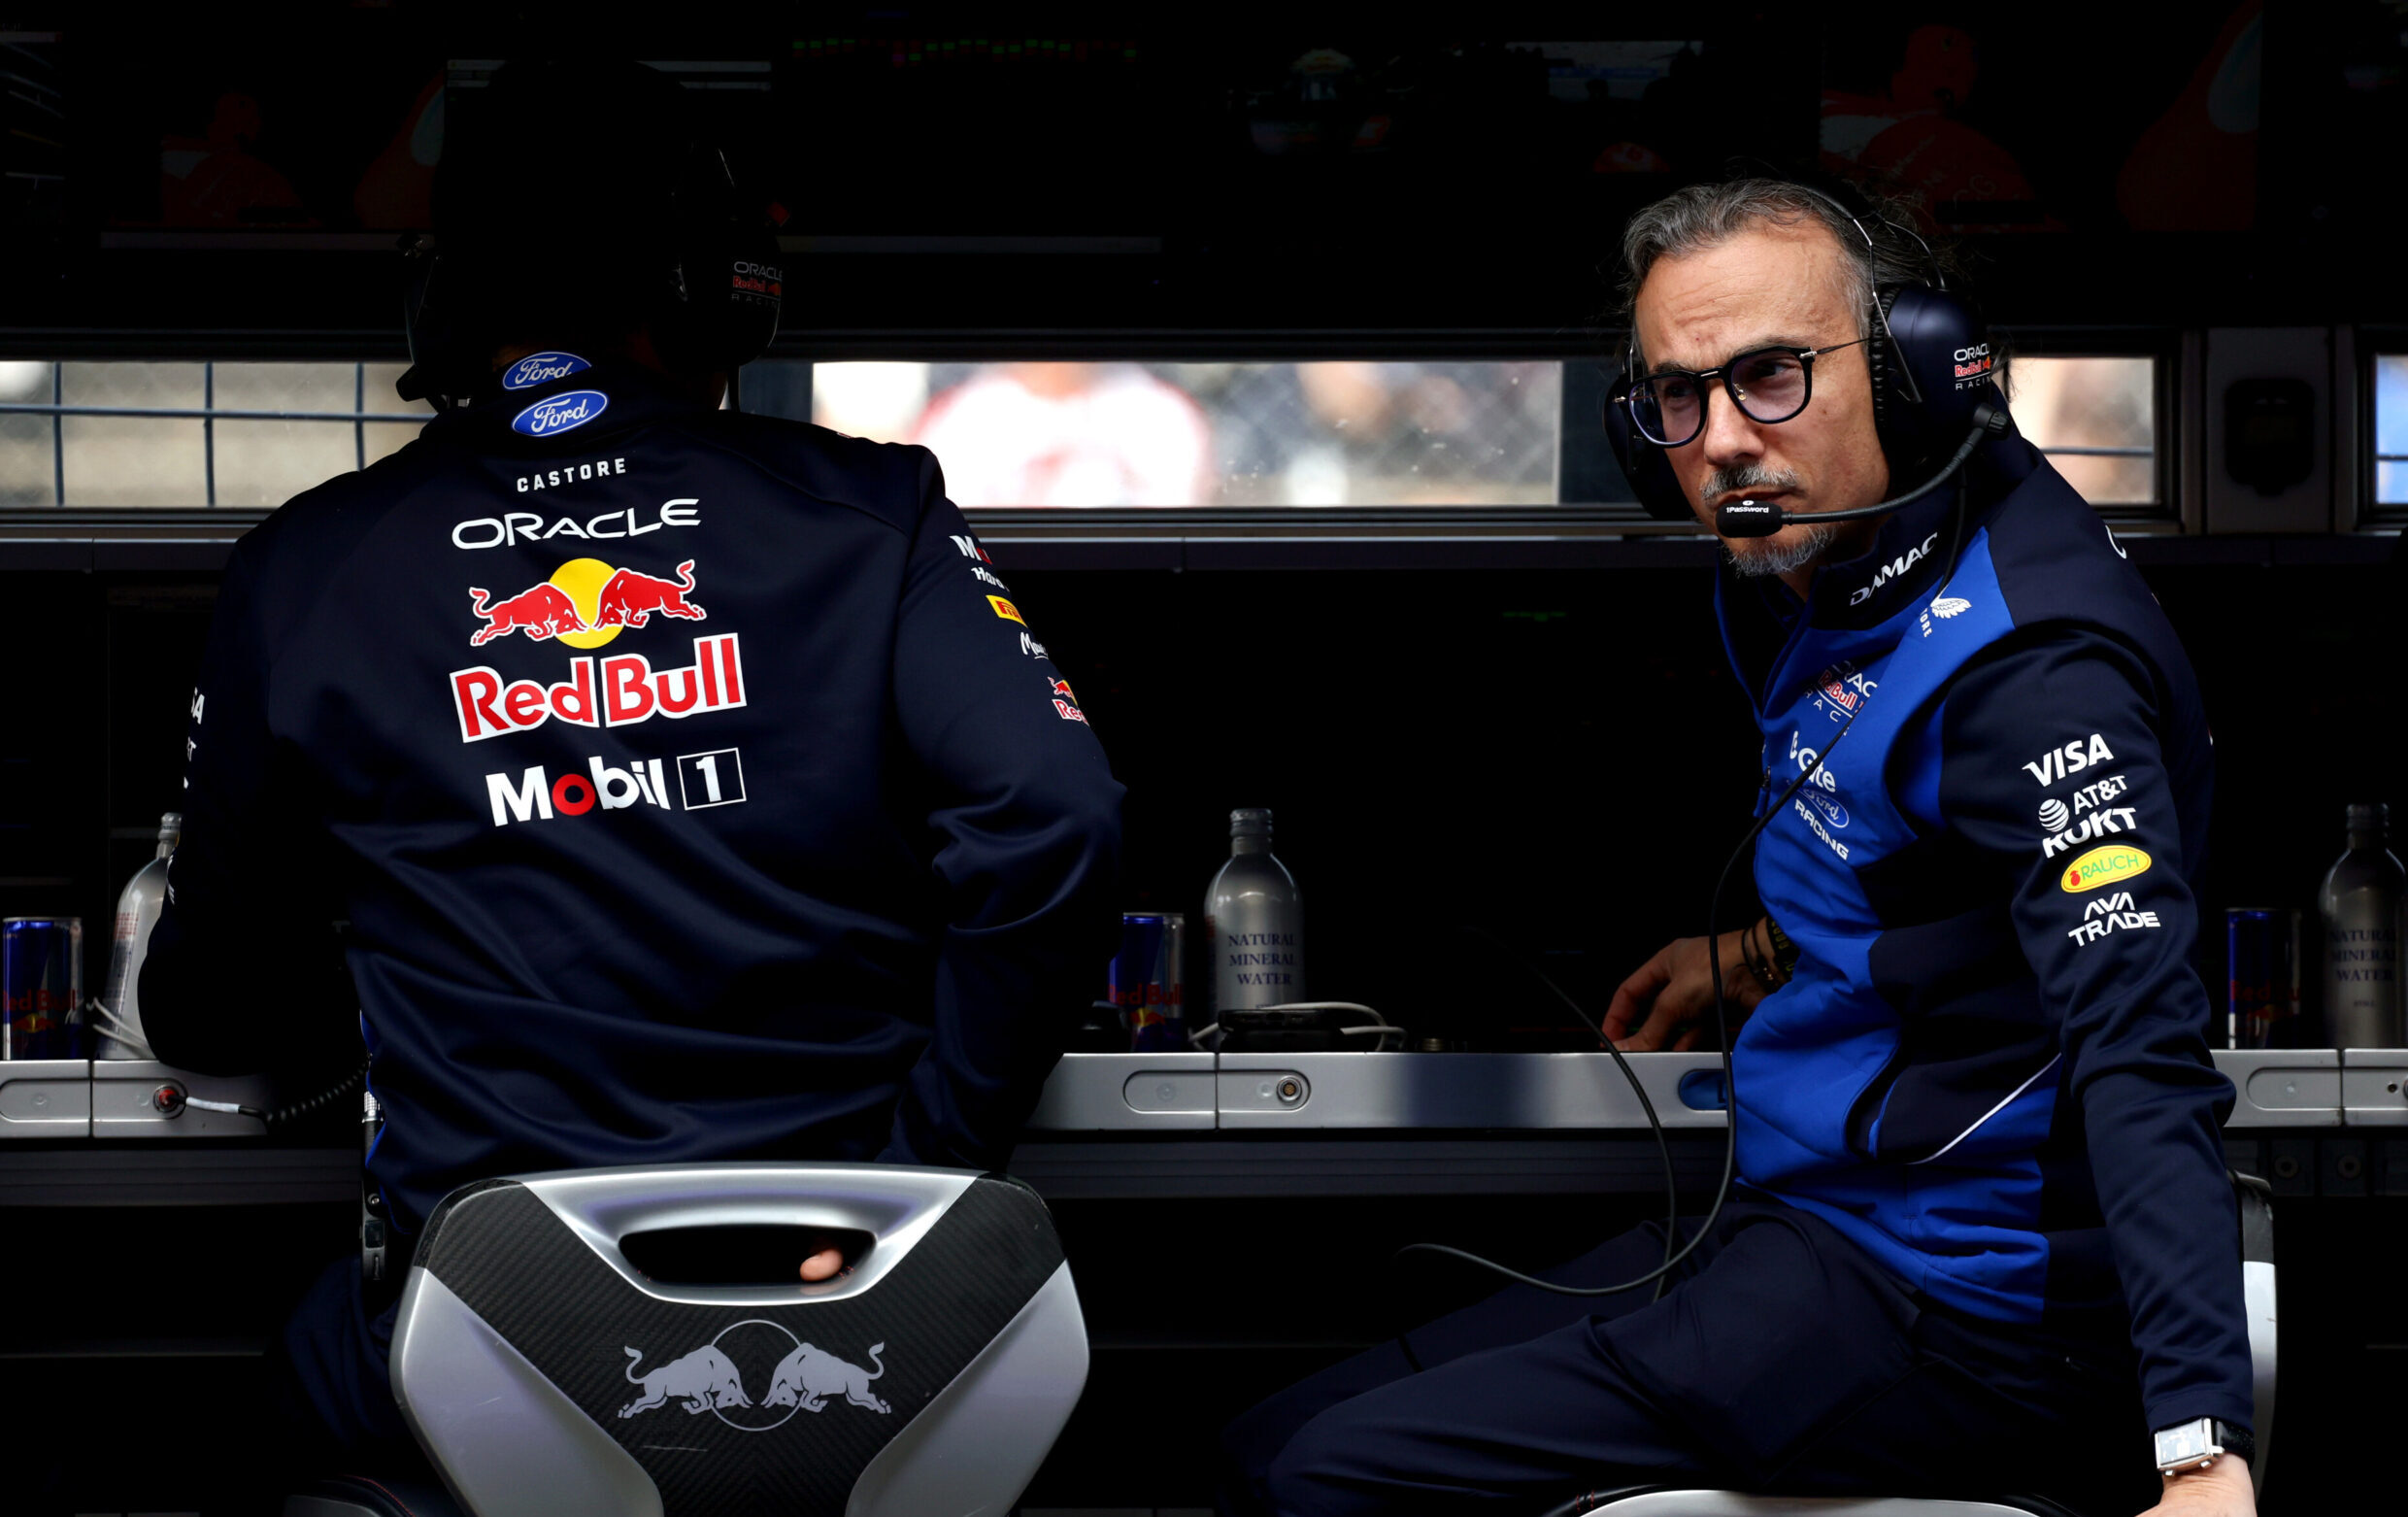
Red Bull’s dominance has reshaped how teams approach race weekends and strategy. Fans following F1 betting markets can see how consistent excellence changes the way odds are priced across a season — and how even small setbacks ripple through predictions. This consistency provides a stark contrast to the high-stakes, random events that altered famous races, reminding forecasters that no model can ever fully account for the unexpected.
Want to try your hand? Look for historical datasets, build simple baseline models, then iterate. Start small, keep notes, and treat every wrong prediction as a lesson, not a failure.
Share your take. Did a model ever surprise you? Drop a comment and tell us which variables you’d trust most when predicting a winner.